A dose-response curve is the standard way to characterise a compound, and with peptides it has failure modes that small-molecule work does not. The compound adsorbs to plastic, binds albumin in your medium, degrades in solution, and — most consequentially — arrives in a vial whose actual peptide content is not the number on the label. This post covers the decisions that determine whether the curve means anything.
Why does the stock concentration decide everything?
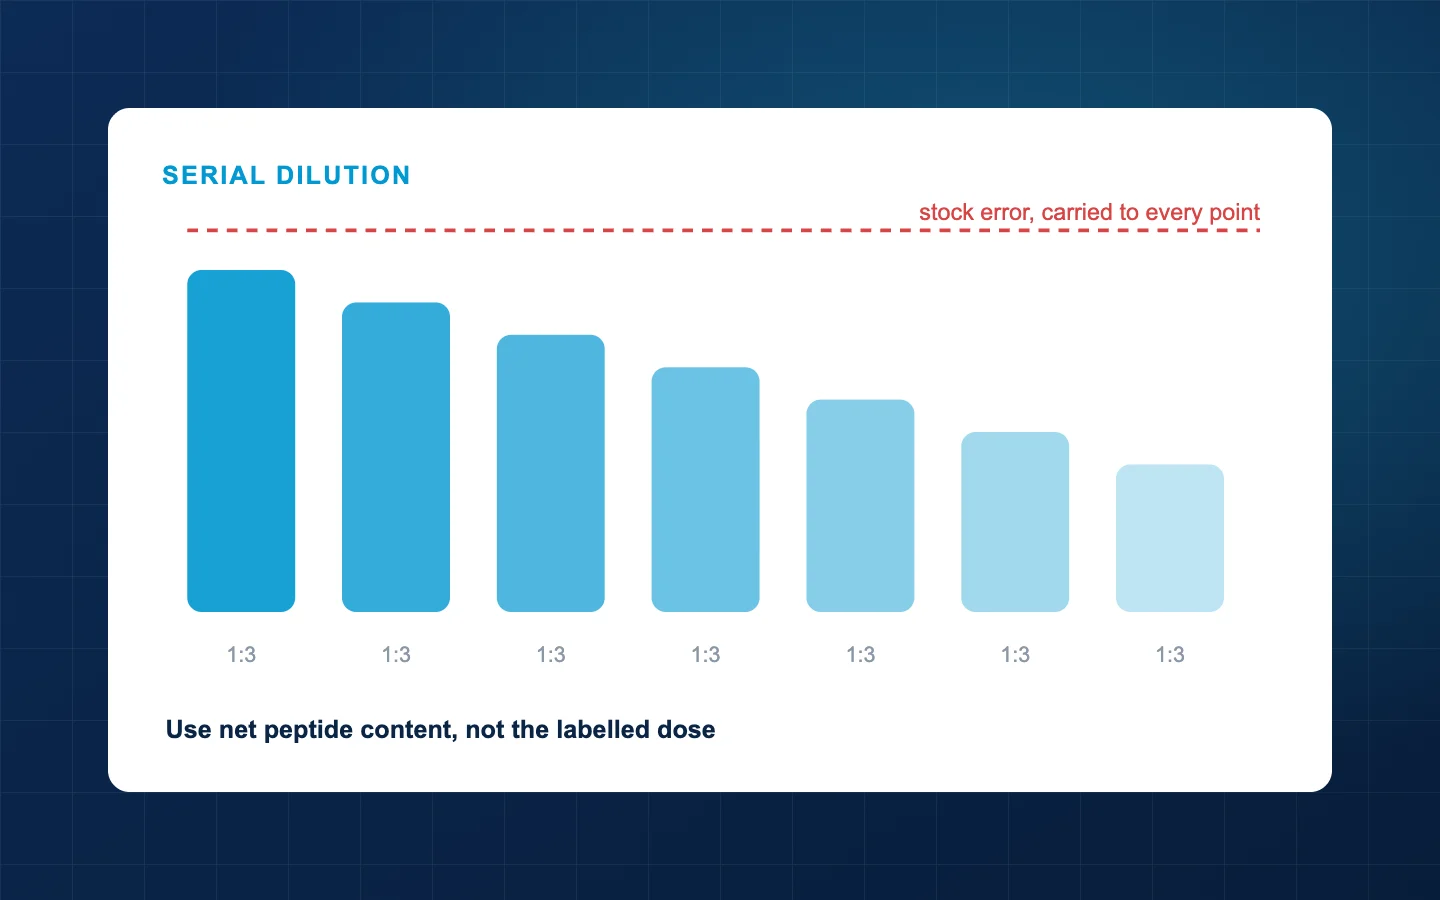
A serial dilution is a chain. Each point is derived from the one before, so an error in the stock concentration does not average out — it propagates through every point identically.
Take a 5 mg vial in 2 mL. Using the labelled dose you would call the stock 2.5 mg/mL. If the certificate reports 4.7 mg net peptide content, the true stock is 2.35 mg/mL, 6% lower. Every point in your series is then 6% lower than recorded, and a derived EC50 is shifted by the same 6%.
The shape of the curve survives this — relative comparisons within one experiment remain valid. What does not survive is the absolute number, which is the thing you would publish or compare against another lab's figure.
So: use net peptide content, not the labelled dose. Our net content post covers why the two differ, and molarity vs milligrams covers converting it.
How wide and how fine should the range be?
Two decisions: how wide, and how fine.
Width. Span enough that you capture both plateaus. A curve that only shows the rising portion gives an EC50 the fit invented rather than measured. Three to four orders of magnitude is the usual starting span when you have no prior.
Step size. Half-log steps (a factor of ~3.16) are the common compromise — roughly 7 points per 3 logs, enough to define a sigmoid without consuming a plate. Full-log steps are coarse but fine for a first pass to locate the range; quarter-log is for refining a known region.
| Step | Factor | Points per 3 logs | Use for |
|---|---|---|---|
| Full log | 10× | 4 | First pass, locating the range |
| Half log | 3.16× | 7 | Standard dose-response |
| Quarter log | 1.78× | 13 | Refining a known EC50 |
Serial versus individual dilutions. Serial is fewer pipetting steps and less material, but compounds error down the chain. Individual dilutions from the stock each carry only one step's error but use more material. For a definitive curve, individual dilutions are worth the extra volume.
Which controls do peptides specifically need?
A vehicle control at matched concentration. If you used DMSO to get a hydrophobic peptide into solution, every well must see the same final DMSO — including the zero-peptide control. Otherwise the solvent's effect rides along with the compound's. Our diluent post covers when organic solvent is needed at all.
Matched serum across every condition. Acylated peptides bind albumin, so serum percentage changes free concentration. Varying it between conditions introduces a confound that looks exactly like a dose effect. Our post on why trial data does not transfer covers the mechanism.
A same-day stock. Comparing a curve run from a fresh stock against one from a three-week-old vial confounds compound with age.
A blank for the diluent itself, particularly if it is bacteriostatic water — benzyl alcohol is not inert in cell work, as our bacteriostatic water post shows with the arithmetic.
How do you compare two compounds fairly?
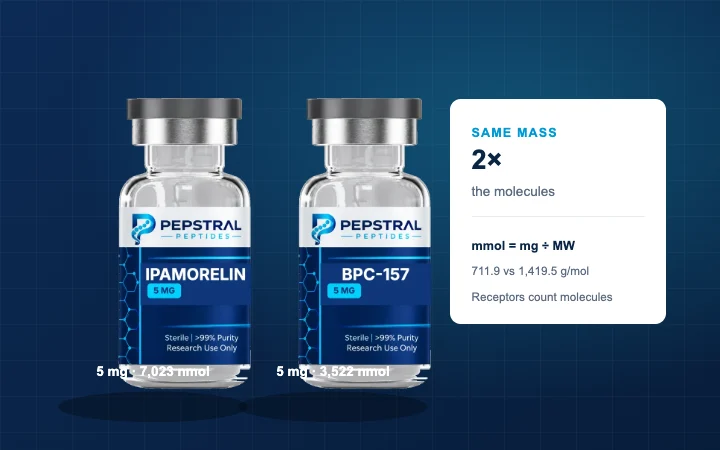
Only in molar units. Mass is not amount: a 5 mg vial of ipamorelin holds roughly 7,000 nanomoles and a 5 mg vial of BPC-157 about 3,500, because ipamorelin is half the molecular weight. Two curves plotted against mass would sit an entire twofold apart for a reason that has nothing to do with biology.
The same applies to a blend. A co-lyophilized vial has two molar amounts, not one, and a single concentration for it is not a meaningful number — the argument our blends post makes for buying components separately when the ratio is a variable.
Two practical losses to plan for
Adsorption. Peptides stick to polypropylene and polystyrene. At the low end of your range — where a meaningful share of the peptide can end up on the tube wall — the real concentration is lower than calculated. Low-binding plasticware and avoiding unnecessary transfers both help.
Degradation over the plate's life. If exposure runs for days, the compound is sitting in warm buffered medium the whole time. Manning and colleagues' review covers what that does. A medium change with fresh compound is more defensible than assuming persistence.
What to record
The full set, because a curve is uninterpretable without it: supplier, lot, purity, net peptide content, diluent and its preservative, stock concentration, the dilution scheme, serum percentage, plate material, and the interval between reconstitution and use. Our methods post lists them as a checklist.
Frequently asked questions
How many replicates?
Enough to estimate variance meaningfully — three technical replicates within a plate and at least three independent experiments is the common standard. Technical replicates measure your pipetting; independent runs measure the biology.
Should the curve go through zero?
Include a genuine zero — vehicle only, no peptide. Fitting a sigmoid without an anchored baseline lets the fit choose one.
What if the top plateau never appears?
Either the range is too low, or solubility capped you before saturation. The second is common with hydrophobic peptides and is a real finding worth reporting rather than extrapolating past.
Can I reuse a thawed aliquot for a second curve?
Better not to. Each freeze-thaw cycle drives aggregation, and aggregated peptide lowers free concentration by an unknown amount — the failure our aggregation post covers, which no certificate will show you.
References
- Manning MC, Chou DK, Murphy BM, Payne RW, Katayama DS. Stability of protein pharmaceuticals: an update. Pharmaceutical Research 2010;27(4):544-575. doi.org/10.1007/s11095-009-0045-6
- Bachem. Quality Control of Amino Acids and Peptides: A Guide. Net peptide content. www.bachem.com/knowledge-center/quality-control-of-amino-acids-peptides-a-guide
- Niu CH, Chiu YY. FDA perspective on peptide formulation and stability issues. Journal of Pharmaceutical Sciences 1998;87(11):1331-1334. doi.org/10.1021/js9800782
Every product mentioned is sold for laboratory research use only and is not for human or animal use. Nothing on this page describes or recommends use of the material sold here in humans or animals.