A certificate reports 99.4% and the reasonable next question is what the other 0.6% is. The answer is more specific than "impurities", and it is reassuring in one way and worth attention in another: almost all of it is closely related peptide, produced by a small number of predictable failures. Knowing which failures produce which species is what lets you read an impurity profile rather than just a number.
How does the synthesis actually work?
Solid-phase peptide synthesis builds the chain one residue at a time on a solid resin bead, C-terminus first. Each cycle has two steps: deprotect the growing chain's end, then couple the next residue onto it. Repeat, then cleave the finished chain off the resin and purify.
Jones's account of the method in Amino Acid and Peptide Synthesis lays out why this architecture won: the growing chain is anchored, so excess reagents can be washed away between steps rather than separated chromatographically. Everything about the impurity profile follows from that cycle.
What are the four things that go wrong?
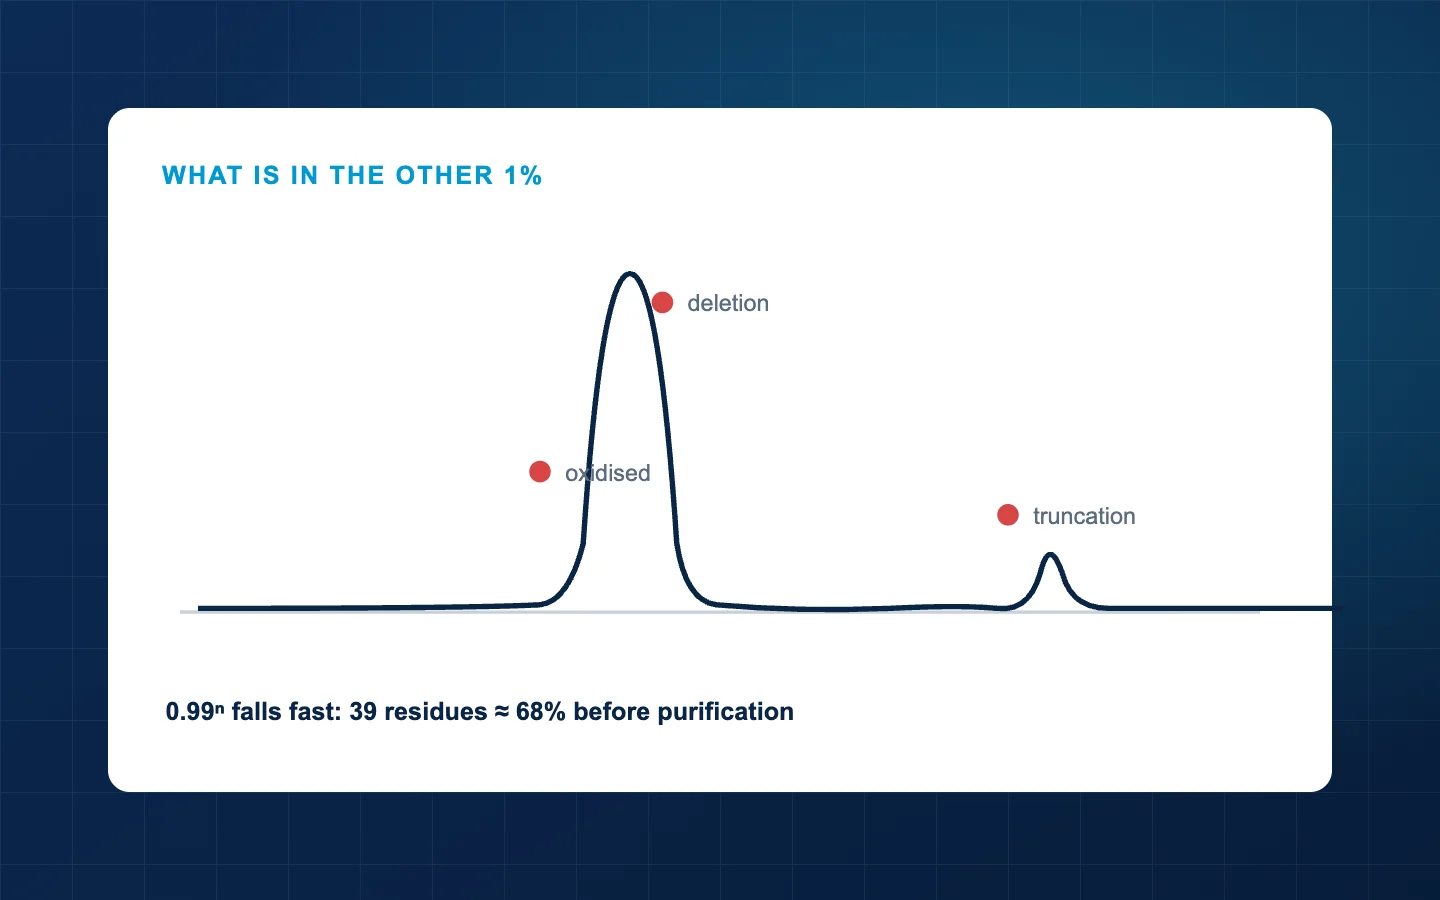
Deletion sequences. A coupling step does not go to completion. A fraction of chains do not receive that residue — and then carry on growing without it. The product is a peptide missing one residue from the middle. This is the commonest defect, and on a chromatogram it usually sits close to the main peak because it is nearly the same molecule.
Truncated sequences. A chain stops growing entirely and is capped, leaving a short fragment. These are more different from the target and separate further out on the chromatogram.
Oxidation. Methionine and cysteine oxidise, during synthesis, workup or afterwards. Methionine picks up 16 Da as the sulfoxide, which our LC-MS post covers as one of the mass shifts a certificate's identity line can catch.
Deamidation. Asparagine and glutamine lose their amide, adding roughly 1 Da and changing the charge. This continues after manufacture, particularly in solution — the subject of our stability post.
| Impurity | Cause | Mass change | Where it elutes |
|---|---|---|---|
| Deletion sequence | Incomplete coupling | −57 to −186 Da | Close to the main peak |
| Truncation | Chain capped early | Large negative | Well separated |
| Oxidised Met | Oxygen exposure | +16 Da | Usually just before the main peak |
| Deamidated Asn/Gln | Hydrolysis of the amide | +1 Da | Very close, often a shoulder |
| Residual protecting group | Incomplete cleavage | Variable, positive | Later — more hydrophobic |
Why does length matter so much?
Because the failures multiply. If each coupling step succeeds 99% of the time, the share of chains that are perfect after n steps is 0.99ⁿ.
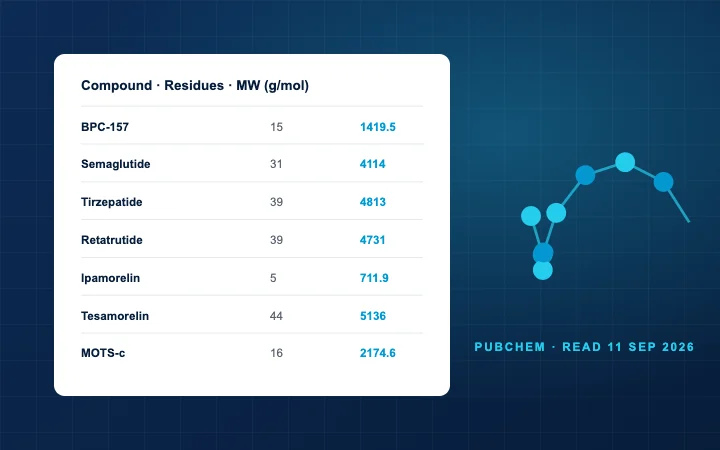
- 15 residues (BPC-157): 0.99¹⁴ ≈ 87%
- 29 residues (sermorelin): 0.99²⁸ ≈ 75%
- 39 residues (retatrutide): 0.99³⁸ ≈ 68%
- 44 residues (tesamorelin): 0.99⁴³ ≈ 65%
Those are crude-mixture numbers, before purification. Real coupling efficiencies are usually better than 99%, and difficult sequences are worse — but the shape of the curve is the point. A long peptide leaves the synthesiser as a substantially mixed product, and the purification is what turns it into a 99% material.
This is a large part of why longer peptides cost more, as our pricing post explains: you are paying for the material discarded during purification as much as for the synthesis.
Why the profile beats the number
Two lots both reporting 99.0% can be very different materials.
Lot A: one impurity at 1.0%, a single deletion sequence. You know exactly what it is, it is closely related, and it is consistent between batches.
Lot B: twenty impurities at 0.05% each, none identified. The total is identical. What you have is a poorly-controlled process, and batch-to-batch consistency is unlikely.
For most in-vitro work Lot A is the better material despite the identical figure — and you cannot tell them apart from the percentage alone. That is the argument for publishing the chromatogram, covered in our chromatogram post, and it is the same reasoning behind our post on whether 98% is good enough.
What does the purity number not include?
Worth restating because it is a persistent confusion: HPLC-UV at 220 nm sees peptide bonds. Counter-ion, residual water and inorganic salts are invisible to it and are not counted in the 1%. They are a large share of what is physically in the vial and a separate question entirely — the one net peptide content answers.
Frequently asked questions
Can a supplier identify the impurities?
Yes, with LC-MS on the impurity peaks — each species has a characteristic mass shift. It costs more than a purity run, so it is uncommon on research-grade certificates, but it is a reasonable thing to ask about for a compound you will use heavily.
Does higher purity mean the impurities are different?
Usually it means the same species in smaller amounts, since the profile is set by the synthesis and purification removes proportionally. A jump from 95% to 99% is generally more purification, not a different route.
Are deletion sequences biologically active?
Sometimes, and that is precisely why they matter. A peptide missing one residue may still bind its receptor, possibly with different affinity — so a deletion impurity is not necessarily inert background in your assay.
Should I worry about a shoulder on the main peak?
A small one is normal and already counted in the purity figure. A large one, or one that grows between lots, is worth raising with the supplier.
References
- Jones J. Solid phase peptide synthesis. In: Amino Acid and Peptide Synthesis. Oxford University Press, 2002. doi.org/10.1093/hesc/9780199257386.003.0009
- Bachem. Quality Control of Amino Acids and Peptides: A Guide. Impurity profiles and chromatographic purity. www.bachem.com/knowledge-center/quality-control-of-amino-acids-peptides-a-guide
- Niu CH, Chiu YY. FDA perspective on peptide formulation and stability issues. Journal of Pharmaceutical Sciences 1998;87(11):1331-1334. doi.org/10.1021/js9800782
Every product mentioned is sold for laboratory research use only and is not for human or animal use. Nothing on this page describes or recommends use of the material sold here in humans or animals.