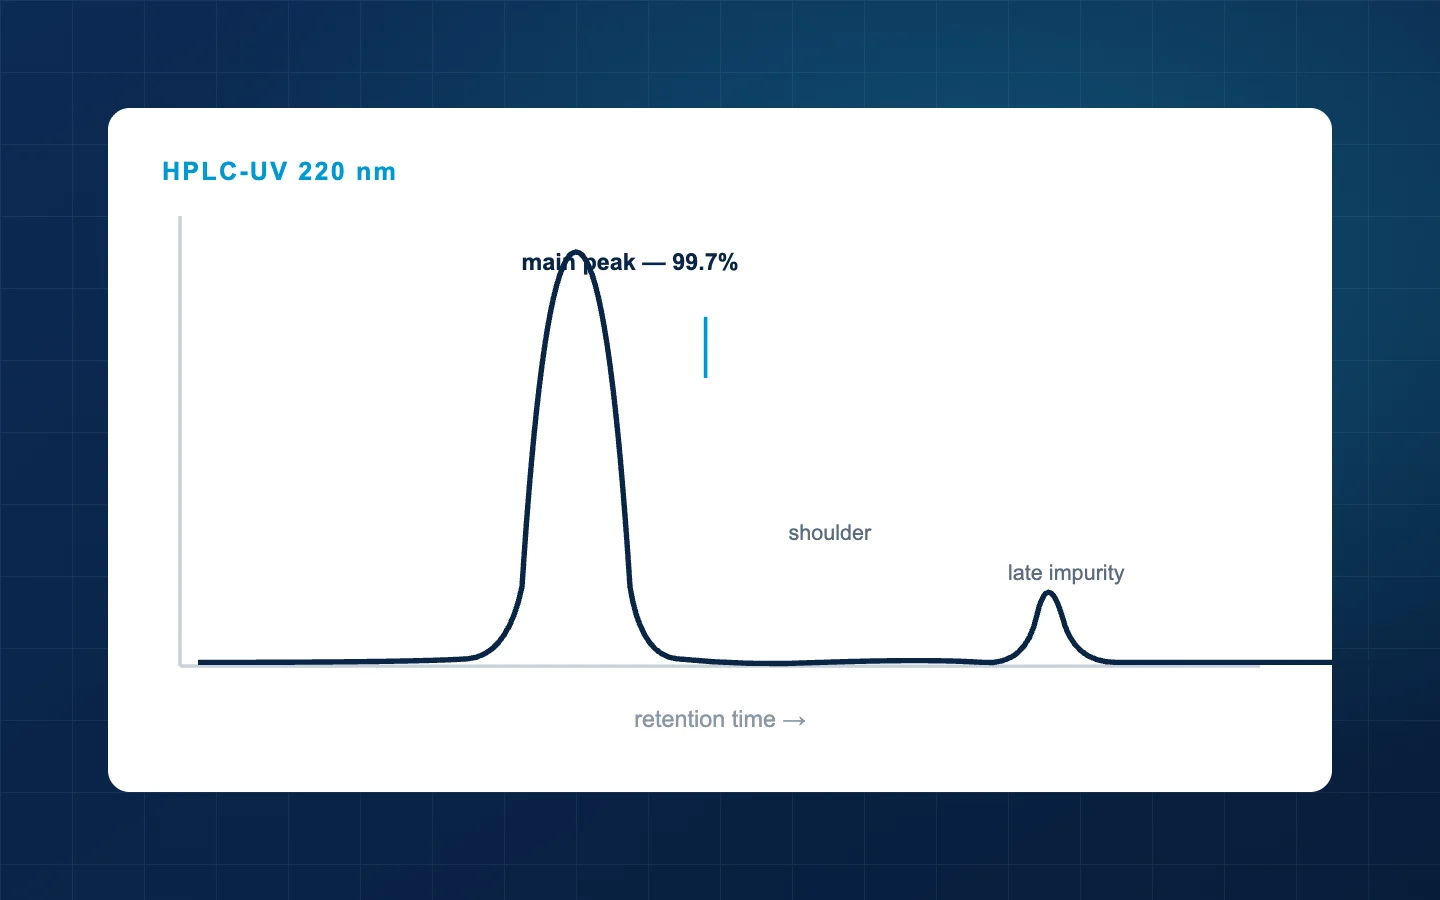
Most buyers read the purity line and stop. The chromatogram it came from is the more informative object, and reading it takes about a minute once you know what the axes are. This post covers what the trace shows, what the common shapes mean, and which features are worth a question to the supplier.
What are the axes?
Retention time runs along the bottom, usually in minutes. It is how long a species took to come off the column. In reversed-phase HPLC — the standard for peptides — the column is non-polar and the mobile phase becomes progressively less polar over the run. More hydrophobic molecules stick longer and elute later.
Absorbance runs up the side, typically in milli-absorbance units. It is how much light the detector's flow cell absorbed at the set wavelength as material passed through.
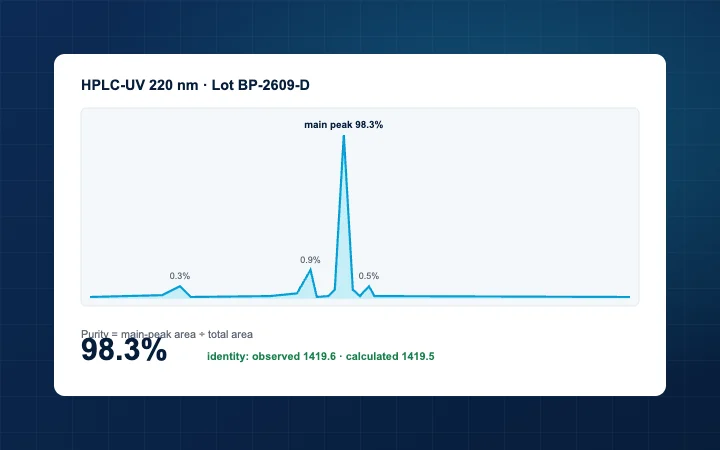
Purity is then the area under the main peak divided by the total area under all peaks, as a percentage. It is a ratio of what the detector saw, which is why our post on net peptide content argues it tells you nothing about how much peptide is in your vial.
Why does the wavelength matter?
Because it decides what is visible at all. A certificate should say the wavelength, and for peptides it is almost always 220 nm.
At 220 nm the absorbing feature is the peptide bond itself. That means every peptide-related species shows up — the target, deletion sequences, truncations, modified forms — roughly in proportion to how many bonds each carries.
It also means things without peptide bonds are invisible. Trifluoroacetate, inorganic salts and residual water absorb nothing meaningful there and contribute nothing to the peak area. They are not counted as impurities because the method cannot see them. That is not a flaw; it is what the method is for.
A run at 280 nm instead would see only aromatic residues — tryptophan, tyrosine, phenylalanine — and a peptide without them would barely register. A purity figure without its wavelength is an incomplete claim.
What do the shapes mean?
| Feature | Usually means | How concerned to be |
|---|---|---|
| One sharp symmetrical peak | Clean material | This is the target |
| A shoulder on the main peak | A closely related species — deletion, deamidation, oxidation | Normal in small amounts; the purity figure already counts it |
| A small peak well after the main one | Something more hydrophobic — often a protected or modified form | Normal in small amounts |
| A cluster of small early peaks | Polar species, sometimes hydrolysis fragments | Worth noting if large |
| Peak splitting at the top | Column or method problem, or two co-eluting species | Ask |
| Heavy tailing | Column ageing, overload, or secondary interactions | Ask |
| Drifting baseline | Gradient or detector issue | Ask |
The pattern worth internalising: how far a peak sits from the main one tells you how different the molecule is. A deamidated peptide differs by one dalton and a single charge, so it elutes very close — often as a shoulder. A truncated sequence missing several residues is a substantially different molecule and separates cleanly.
What does a good trace look like?
Flat baseline before and after. One dominant, symmetrical peak. Any other peaks small and well resolved. The main peak should not be so tall it flattens at the top, which means the detector saturated and the area is underestimated.
You should also be able to tie it to the vial: the certificate should name the lot, and that lot should be printed on the label. Our vial label post covers that chain, and the COA library is where each of ours is published.
What can a chromatogram not tell you?
It cannot confirm identity. A single clean peak says one species dominates; it does not say which species. That is what the mass spectrometry line is for — an observed mass matched against the calculated mass for the sequence. Purity and identity are separate claims from separate methods, and a certificate needs both.
It also cannot tell you the material is safe to use in cell work. Endotoxin is a separate assay entirely, covered in our endotoxin post.
Frequently asked questions
Is 99% always better than 98%?
Not necessarily, and our post on what purity figures mean covers this at length. What matters is the impurity profile: 1% of a single closely-related species is a different situation from 1% spread across a dozen unknowns.
Why do two labs report different purity for the same lot?
Different columns, gradients, wavelengths and integration settings all shift the number. This is why the method belongs next to the figure, and why an independent test is compared as a second opinion rather than as a verdict — see our independent testing post.
What is integration, and can it be gamed?
Integration is where the software draws the baseline and decides where each peak starts and stops. Choices there change the areas. A trace published alongside the number lets you see whether the integration looks reasonable — which is the argument for publishing the chromatogram, not just the percentage.
Should a certificate include the actual trace?
Ideally yes. A number alone asks you to trust the integration; the trace lets you check it.
References
- Bachem. Quality Control of Amino Acids and Peptides: A Guide. Chromatographic purity, detection and impurity profiles. www.bachem.com/knowledge-center/quality-control-of-amino-acids-peptides-a-guide
- Niu CH, Chiu YY. FDA perspective on peptide formulation and stability issues. Journal of Pharmaceutical Sciences 1998;87(11):1331-1334. doi.org/10.1021/js9800782
- GenScript. Recommended peptide purity levels by application. www.genscript.com/recommended_peptide_purity.html
Every product mentioned is sold for laboratory research use only and is not for human or animal use. Nothing on this page describes or recommends use of the material sold here in humans or animals.