
A certificate is read one at a time, for the lot in hand. Read together, 114 of them say things no single one can: how tightly the laboratory's purity method clusters, how fills compare to labels across a whole catalogue, when methods changed, and which lines actually vary from lot to lot. This post is that reading. The data is every certificate in the COA library, exported on 2 October 2026 as one CSV file that anyone can check against the laboratory's own verification page.
Two limits first, because they shape everything below. All 114 certificates were issued by one laboratory, Bioviridian Inc., for one vendor. The dataset therefore describes that laboratory's methods and this catalogue's lots; it says nothing about other vendors, other laboratories or the market. And a vendor lists lots that passed, so the absence of a failing certificate here is a listing policy, not a failure rate.
What is in the dataset?
| Certificates | 114 |
|---|---|
| Compounds | 47 (16 with a single lot; tirzepatide has 10 lots, retatrutide 9) |
| Current / superseded | 71 current, 43 replaced by a newer lot and kept in the library |
| Issue months | April 2026 (21), June 2026 (39), August 2026 (54) |
| Single-compound vials / blends | 96 / 18 |
| Label sizes | 22 distinct labels; 10 mg is the commonest (41), then 20 mg (16) and 5 mg (12) |
| Tests per certificate | 4 tests on 21 certificates, 5 on 67, 6 on 26 |
| Sample descriptions | 103 white lyophilized powder, 9 blue (GHK-Cu, the two copper-containing blends and one retatrutide lot, as the certificates describe them), 1 orange (5-amino-1MQ), 1 clear liquid (a March P-21 lot) |
Every certificate carries identity, purity, content and endotoxin. Heavy metals appears on 93 and sterility on 26. The reading-a-COA guide explains each line; this post is about how they behave across lots.
How tightly does purity cluster?
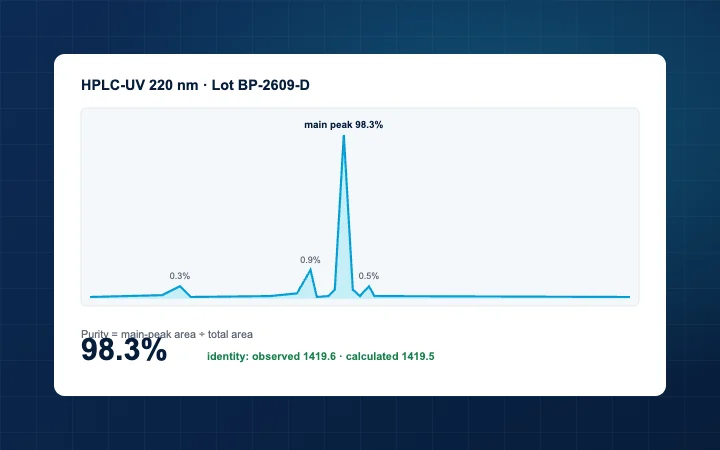
Every certificate reports purity by RP-HPLC at 214 nm, as area percent. Across 114 lots the figure runs from 99.55% to 99.90%, with a median of 99.80%.
| Purity band | Certificates |
|---|---|
| 99.5 to 99.6% | 1 |
| 99.6 to 99.7% | 5 |
| 99.7 to 99.8% | 32 |
| 99.8 to 99.9% | 38 |
| 99.9% and above | 38 |
The lowest current-lot purity in the catalogue is IGF-1 LR3 at 99.55%; the next are P-21 at 99.60% and epithalon, pinealon and TB-500 at 99.68%. The spread is a third of a percentage point. What that says is that the laboratory's method, on this vendor's material, resolves a main peak at about the same share every time; the area-percent post explains why that number is a ratio of peak areas and the one-percent post explains what the remainder is likely to be. What it does not say is that every research peptide is this pure. It says every lot this vendor listed, tested by this method, was.
Purity under the LC-MS/MS months averages 99.78%, against 99.85% under the MALDI months. The identity method does not affect the purity measurement, which is a separate HPLC run; the difference is between different lots in different months, and it is small enough to be noise.
How do fills compare to the label?
Content is the certificate's measured mass of peptide, compared here with the label. For the 96 single-compound vials:
| Content ÷ label | |
|---|---|
| Median | 1.030 (3.0% over label) |
| 10th percentile | 1.004 |
| 90th percentile | 1.108 |
| Highest | 1.284 (BPC-157, 5 mg label, 6.42 mg content, a March lot since replaced) |
Fills are set to meet or exceed the label, and the data shows it: nine in ten single-compound lots are at or above label, and the typical lot is three percent over. The tail is wider than the label suggests, which is the argument of the lot-to-lot variability post for using the certificate's content figure, not the label, in any calculation.
Six single-compound certificates, three current and three since replaced, read under the label. Each is already public in the library; here they are in one place:
| Compound | Label | Content on certificate | Lot | Status |
|---|---|---|---|---|
| ARA-290 | 16 mg | 10.86 mg | ARA2901-0803 | Current. The product is sold as 10 mg; the certificate's size label is the discrepancy, flagged on the ARA-290 certificate post. |
| Prostamax | 20 mg | 12.82 mg | PROS20-0318 | Current. 64% of label. |
| Thymalin | 20 mg | 18.79 mg | THYM20-0318 | Current. 94% of label. |
| Pinealon | 20 mg | 19.12 mg | PINE20-0318 | Replaced; the current lot (PINE20-0803) reads 20.80 mg. |
| KPV | 10 mg | 9.86 mg | KPV10-0318 | Replaced by an August lot. |
| SS-31 | 10 mg | 9.76 mg | SS31-10-0318 | Replaced by an August lot. |
Four of the six are within a few percent and inside what a gravimetric content method resolves. Two are not: ARA-290, where the label on the certificate and the label on the product differ and the product is right, and Prostamax, where the certificate reports 12.82 mg against a 20 mg label. Prostamax is the one lot in the dataset whose content figure a buyer should read before ordering, and it is the kind of finding this post exists to surface rather than bury in a library of 114 documents.
The 18 blend certificates are excluded from the fill statistics for a reason that is itself a finding: on a blend certificate the content line reports one component's mass, so a 20 mg BPC-157 + TB-500 vial shows a content of 10.7 mg. That is correct for what was measured and misleading if read against the label. The blend certificate post explains the reading, and the current BPC-157 + TB-500 certificate (COA7621) carries a separate, known transcription problem that is being corrected with the laboratory.
When did the methods change?
| Issue month | Certificates | Identity method | Heavy metals reported | Sterility reported | Median days, receipt to issue |
|---|---|---|---|---|---|
| April 2026 | 21 | MALDI-MS | 0% | 0% | 8 |
| June 2026 | 39 | MALDI-MS | 100% | 67% | 16 |
| August 2026 | 54 | LC-MS/MS | 100% | 0% | 6 |
Three changes are visible only in aggregate. From June the laboratory added a heavy-metals line to every certificate. In June it ran sterility on 26 of 39 lots, and every one of those 26 took 16 days from receipt to issue while the 13 without took 6: a sterility culture needs the incubation time, and the dataset shows it to the day. From August the identity method moved from MALDI-MS, which reports a single molecular mass, to LC-MS/MS, which fragments the ion and reads a sequence ladder; the sequence-verification post sets out why the second is the stronger identity. A buyer comparing a June certificate with an August one for the same compound is comparing two different identity methods, and should know it.
Which lines actually vary?
Purity varies by a third of a percent. Content varies by a quarter of the label at the extremes. Retention time runs from 1.56 minutes (vilon, a dipeptide that barely holds the column) to 11.92 minutes (tirzepatide, with its fatty-acid chain), and is characteristic of each compound rather than each lot. And endotoxin does not vary at all: every certificate reports it as below 0.05 EU/mL, written as "<" on 92 and "≤" on 22. That is the assay's reporting limit, the lowest value it will state. It establishes that no lot exceeded the limit; it cannot rank one lot against another, and a certificate that printed a measured endotoxin value would be saying something different and more. The endotoxin post goes into what the number can and cannot mean.
The practical reading: on these certificates, content is the line that tells lots apart, purity is the line that confirms the method behaved, identity is the line whose method changed, and endotoxin is a pass/fail gate dressed as a number.
How to use the file
The CSV has one row per certificate with the lot, the printed code, the compound, the label size, the dates, the methods, the measured values, the content-to-label ratio, the tests run and whether the lot is current. Sort by content ratio to find the fills; filter by month to see the method change; look up any code on the laboratory's verification page to confirm the row. If a number in this post disagrees with the certificate it came from, the certificate is right and the editorial standards say how to tell us.
Frequently asked questions
Does 99.8% median purity mean research peptides are usually that pure?
No. It means the lots this vendor listed, tested by this laboratory's RP-HPLC method, were. A vendor lists lots that passed, and one laboratory's area-percent figure is not comparable with another laboratory's without knowing both methods.
Why are some lots under the label?
Content is a measured mass and labels are nominal. Four of the six under-label lots are within a few percent, which is inside the method's resolution. ARA-290 is a certificate size-label error against a 10 mg product. Prostamax reads 12.82 mg against 20 mg and is the one lot to read before ordering.
Why does the content line on a blend look wrong?
Because it reports one component's mass, not the vial's total. A 20 mg two-compound blend shows about 10 mg of content. The blend certificate post explains the reading.
Why did turnaround jump to 16 days in June?
Sterility testing. The 26 June lots with a sterility line took 16 days; the 13 without took 6. A culture needs incubation time, and the dataset shows exactly that.
Can I check these numbers myself?
Yes. Every row carries the printed certificate code, and the laboratory's verification page confirms each one. The CSV is linked at the top of the post.
References
- Pepstral certificate library, 114 certificates issued by Bioviridian Inc., read into src/coa.json by the OCR pipeline described on the COA page and republished unaltered. Dataset exported 2 October 2026. pepstral.com/data/certificates-2026-10-02.csv
- Bioviridian Inc. certificate verification page, where every code in the dataset can be checked. bioviridians.com/coa-search.html
- United States Pharmacopeia. General Chapter <85> Bacterial Endotoxins Test. www.usp.org
Every product mentioned is sold for laboratory research use only and is not for human or animal use. Nothing on this page describes or recommends use of the material sold here in humans or animals.